What is school-based Medicaid?

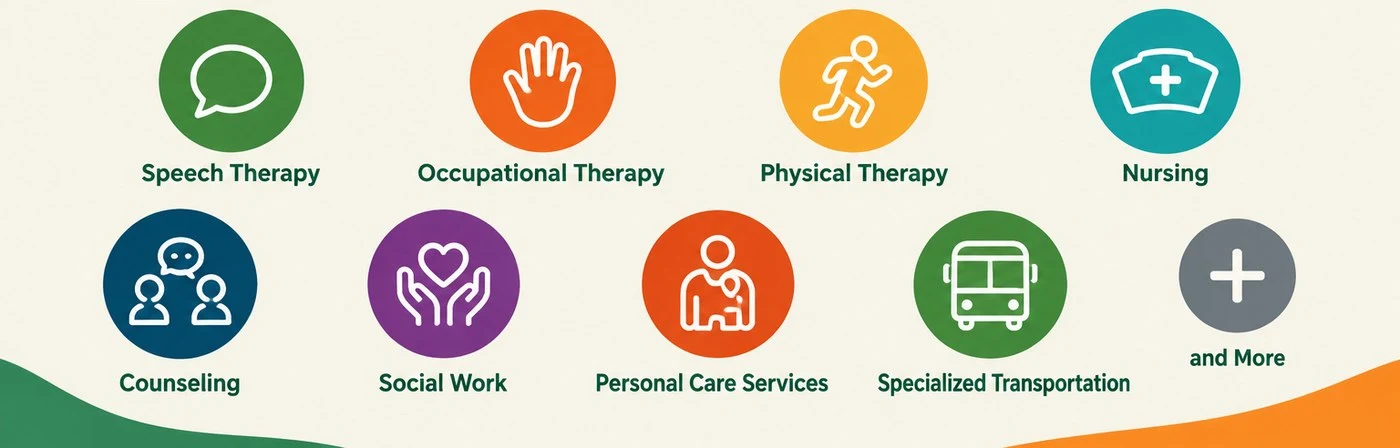
School-based Medicaid programs in K-12 school systems reimburse school districts, charter schools, and other local education agencies for health services they provide to Medicaid-enrolled students — including speech therapy, occupational and physical therapy, nursing, counseling, social work, personal care services, specialized transportation, and more.
School-Based Medicaid Reimbursement: What the Data Show
*A billable student in this Pennsylvania context is defined as a student who has a Medicaid-eligible service in their IEP and is enrolled in Medicaid.
In every state, there is a wide range of performance related to School-Based Medicaid reimbursement. Some districts and charter schools are able to generate thousands of dollars per eligible student. Other districts and charters with similar student body profiles and similar special education expenditure levels generate only a fraction of that amount, resulting in hundreds of thousands of dollars — and sometimes millions of dollars — left on the table each year.
Pictured is a snapshot of the per capita Medicaid-reimbursement distribution of Pennsylvania local education agencies. The bottom three quartiles of LEAs are leaving over $75 million on the table annually relative to the top quartile.
Supporting Medicaid Reimbursement Performance Improvement
School-based Medicaid program implementation requires expert performance management systems and procedures in order to efficiently coordinate the many requirements.
At Mile 2 Consulting, we marry our unique strategic analytics and performance management tools with a comprehensive and detail-oriented approach to program coordination to ensure your district receives every dollar for which it is eligible.
Our states
Each state runs its own program under its own name and rules. Select yours.
Pennsylvania
School-Based ACCESS Program (SBAP)
Medicaid Administrative Claiming (MAC)
View PennsylvaniaAnnouncing: the Pennsylvania awards for excellence in School-Based ACCESS Program Performance Yearly
Click here to see the award winners
California
Local Educational Agency Medi-Cal Billing Option Program (LEA BOP)
School-Based Medi-Cal Administrative Activities (SMAA)
Children and Youth Behavioral Health Initiative (CYBHI)
View CaliforniaMassachusetts
School-Based Medicaid Program — Direct Service Claiming (SBMP / DSC)
Administrative Activity Claiming (AAC)
View MassachusettsOur impact
Direct support
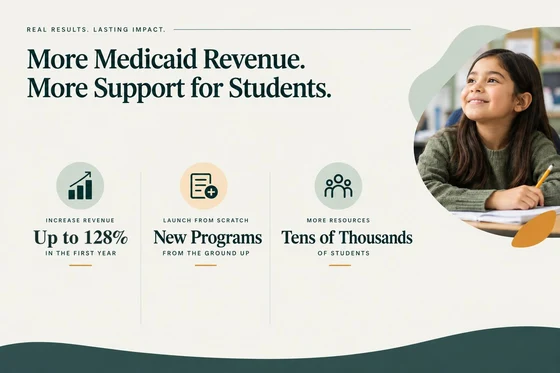
We have helped school systems quickly and dramatically increase their school-based Medicaid revenues by up to 128% in the first year! We have also helped numerous school systems launch new Medicaid billing programs from scratch. These success stories mean that our client schools are able to give tens of thousands of students with special needs access to significantly more resources and support.

Research
We have developed the nation’s most comprehensive quantitative database of school-based Medicaid performance across dozens of states. We are able to provide unparalleled insights into the performance and the opportunities for school-based Medicaid services for school systems.